Open account
Open accountLog In
Open account

Aug 06, 2025

Technical analysis

When the Candle Speaks: What the Gravestone Doji Tells Traders

Gravestone Doji

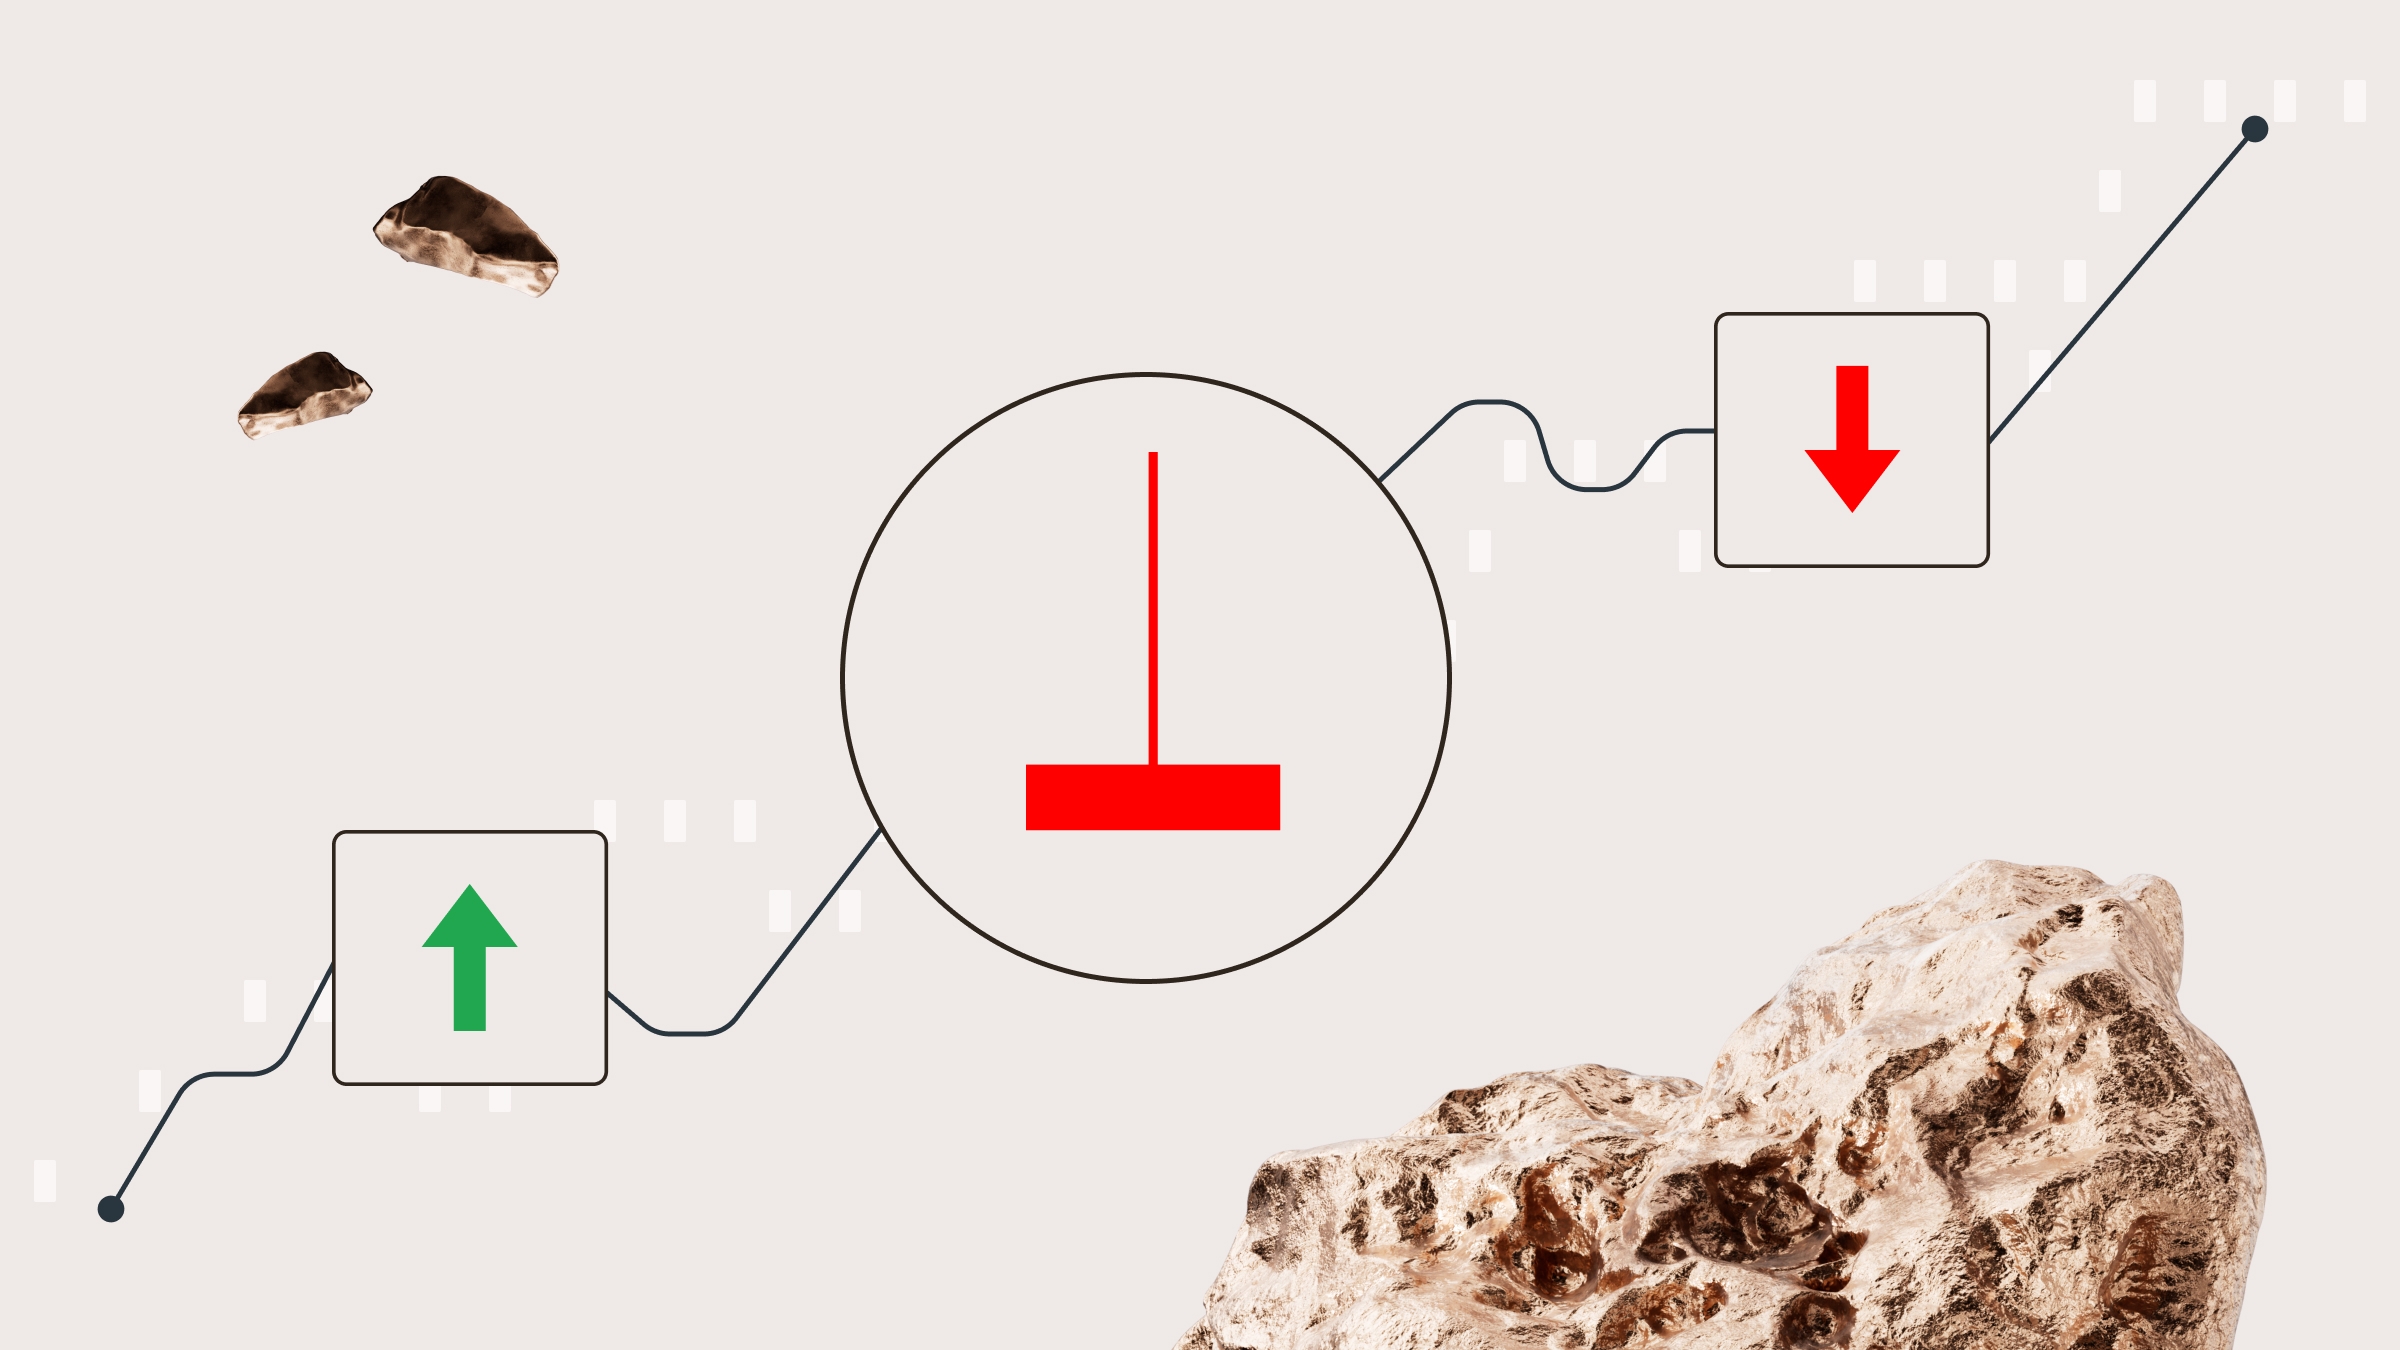
In trading, some signals are loud and clear. Others are more subtle, like a pause in conversation that says more than words. The Gravestone Doji falls into that second category.

It’s just one candle, but it can quietly hint that bullish momentum is fading and a reversal may be on the horizon. For traders who know how to read it, this pattern can offer a valuable heads-up.

What is a Gravestone Doji

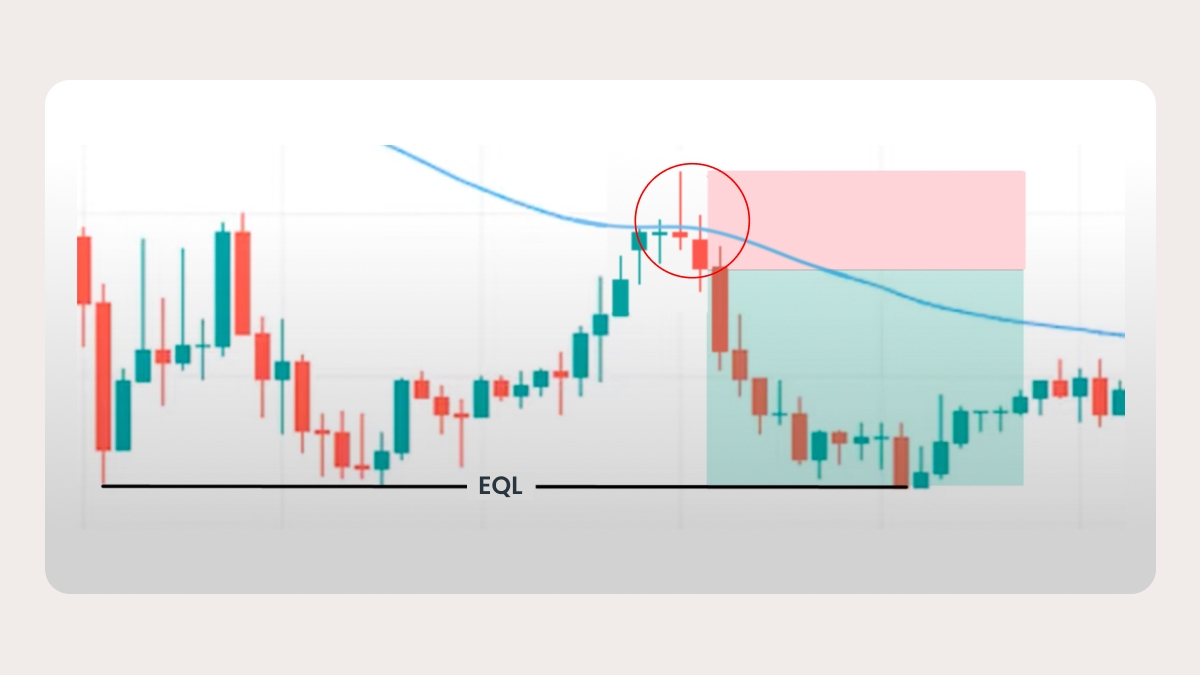
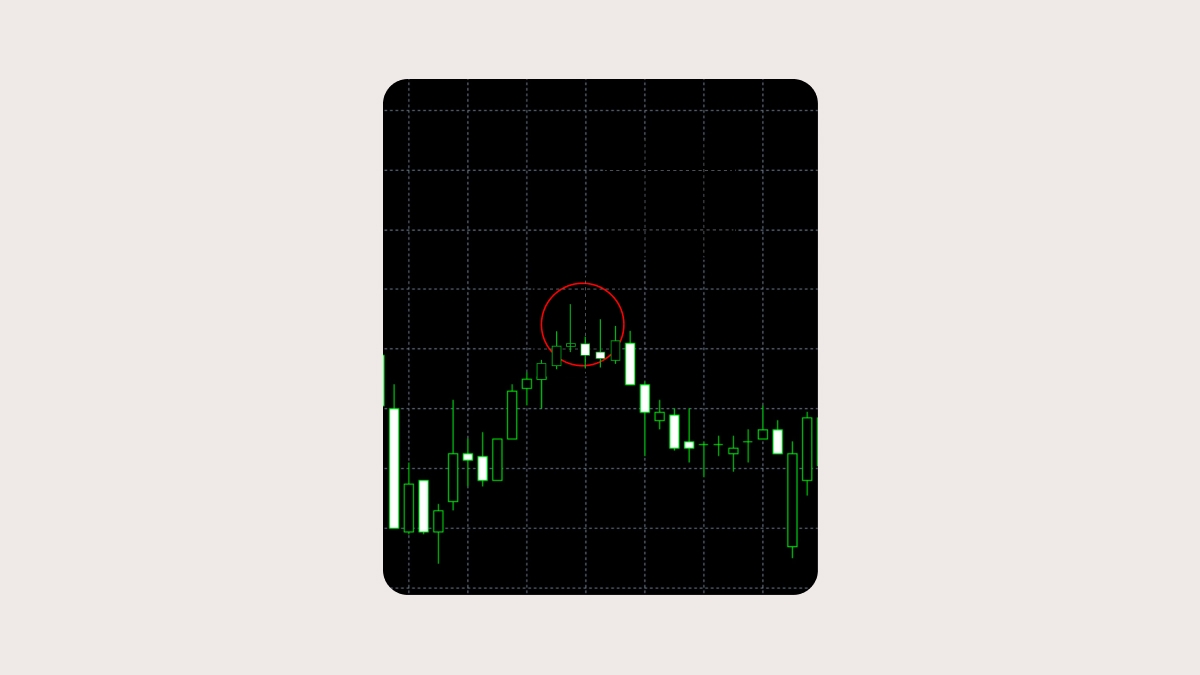
The Gravestone Doji is one of those patterns that can quietly hint at trouble after a bullish run. It tends to pop up near the top of an uptrend and suggests that buyers might be running out of steam.

You’ll recognize it by its shape: a long upper wick and a tiny (or nonexistent) body sitting at the bottom. The open, low, and close prices are all close together, which gives the candle its flat base, like an upside-down T.

What is a Gravestone Doji

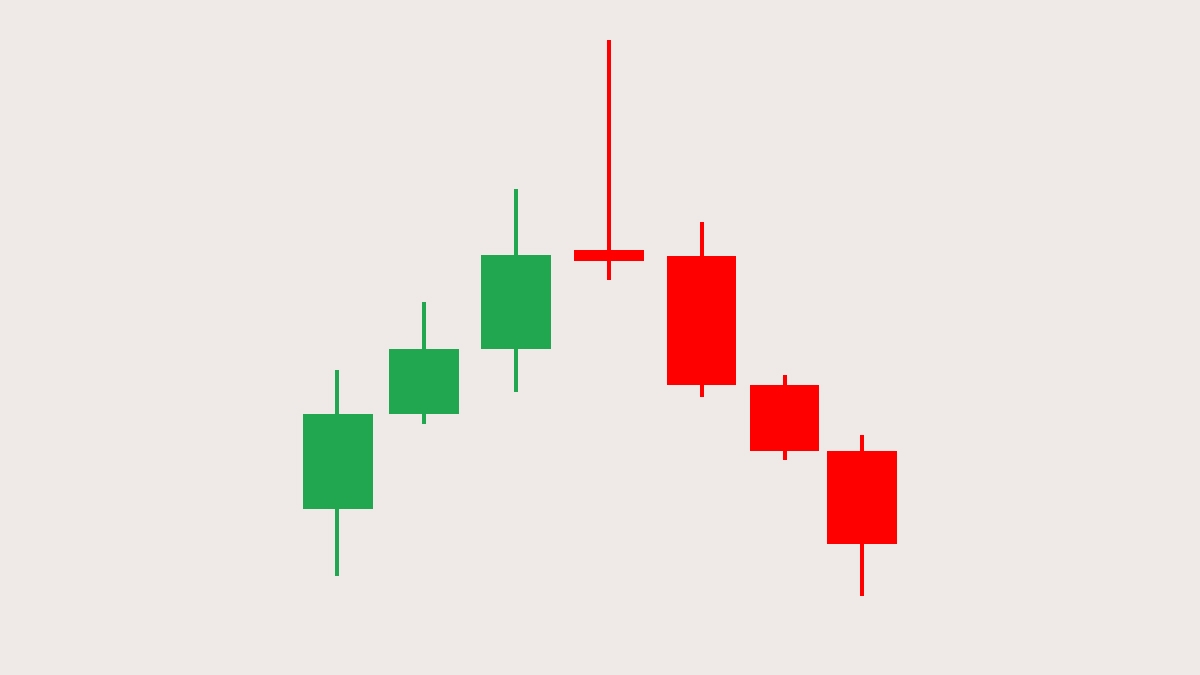
But the real story is in what it tells us: buyers managed to push the price way up during the session, but couldn’t hold it. By the close, sellers had completely wiped out those gains, dragging the price right back down. That kind of rejection at the top often signals a shift in mood.

Best timeframes to watch

The Gravestone Doji can pop up on pretty much any chart, whether you’re looking at one-minute candles or scanning monthly price action. But here’s the thing: not all appearances are equally meaningful.

On short timeframes, like 5-minute charts, it might just be noise. Maybe the market hesitated for a moment, or there was a quick reaction to some small headline, and suddenly you have what looks like a textbook Gravestone. In reality, though, it might not mean much. These fast charts tend to be choppy, and patterns can be misleading if taken too literally.

If you spot the same pattern on a daily or weekly chart, that’s a different story. It starts to matter more. You’re looking at broader price behavior, and that kind of signal can be a clue that momentum is slowing down, especially if it shows up after a strong upward move and right around a resistance area that’s held in the past.

How to identify a Gravestone Doji on a chart

How to identify a Gravestone Doji on a сhart

You don’t need fancy indicators to spot a Gravestone Doji. You just need to know what to look for:

The open, low, and close are all nearly equal, creating a flat base.

The upper wick is long, showing that the price was pushed up during the session.

The lower wick is either very short or completely absent.

Remember, the context matters. This pattern makes sense only when it appears after an upward price move. If you see it forming in the middle of a sideways trend or near the support level, it might just be market noise rather than a reversal signal.

Trading the Gravestone Doji

Recognizing the pattern is only half the job; the real challenge is deciding what to do with it. Here’s a practical way to approach it without making things too complicated.

  1. First, look at where the pattern is forming. If it shows up after a clear upward move, especially near a resistance level, it might be worth looking at further. If it appears in the middle of a choppy market or without any real context, it’s probably not reliable.

  2. Before doing anything else, wait for the next candle. If that one closes below the low of the Gravestone Doji, that’s usually considered a confirmation that the sellers are stepping in. Without that follow-up move, the pattern alone doesn’t mean much.

  3. It can also help to check other indicators. For example, if the RSI is in overbought territory (above 70 or so), that adds weight to the idea that the market’s stretched and due for a pullback.

  4. If the signal looks solid, some traders choose to open a short position once the confirmation candle closes.

  5. As for risk management, a common approach is to place a stop just above the high of the Gravestone’s upper wick. For the exit, many aim for a support level, ideally the one the price reacted to in the past.

Trading the Gravestone Doji

Avoiding common pitfalls

Even if you’ve been trading for a while, it’s easy to slip up when it comes to reversal signals, and the Gravestone Doji is no exception. A few common missteps show up over and over.

Jumping in too fast is probably the biggest one. Spotting the pattern and hitting “sell” right away might feel like you're ahead of the curve. But without a confirming candle, you're just guessing. It’s often the second candle, the one that actually follows through with a bearish move, that tells you whether the signal is real.

Another trap? Forgetting to zoom out. Just because a Gravestone Doji shows up doesn’t mean the whole trend is over, especially in a strong uptrend or when the market’s moving sideways. The context matters more than the shape of one candle.

It’s also easy to overly rely on candlestick patterns, as if they tell you everything on their own. But they don’t. Without checking other factors like volume, overall trend, or even what’s happening on higher timeframes, the signal can be misleading.

And of course, setting no stop-loss. It sounds basic, but if you skip this step, especially on a pattern that’s predicting a reversal, it can turn a small loss into something that ruins your whole setup.

Why traders like the Gravestone Doji

The name sounds dramatic, but once you know what to look for, the Gravestone Doji is one of the easier candlestick patterns to spot. It doesn’t show up every day, and when it does after a decent rally, it can be a pretty good hint that the buying pressure is fading.

A lot of price action traders like it because it’s clean. There’s no guesswork: either the candle has that long upper wick and tiny body near the base, or it doesn’t. And in fast-moving markets, that kind of visual clarity helps. You don’t have to decode it like you would with some of the more complex patterns.

FAQ

What’s a Gravestone Doji?

It’s a candlestick that often shows up after a price increase. The shape looks like an upside-down T, and it can be an early sign that the upward trend is losing strength.

What does it mean when one appears?

It suggests that buyers pushed the price higher during the session, but by the close, sellers had taken over and brought it back down. That shift can point to weakening bullish momentum.

Should I sell when I see one?

Not right away. It’s more of a red flag than a green light. Wait to see if the next candle actually moves lower, and that’s your confirmation.

How do I confirm it’s not a fake-out?

Look at what the next candle does. If it closes lower than the Gravestone’s low, that’s a good sign. You can also check indicators like RSI. If it’s showing the asset is overbought, that supports the bearish case.

Where’s a smart place for a stop-loss?

A common approach is to put your stop just above the Gravestone’s upper wick. That way, if the market keeps going up, you’re out before the losses stack up.

Share with friends:

Open an FBS account

By registering, you accept FBS Customer Agreement conditions and FBS Privacy Policy and assume all risks inherent with trading operations on the world financial markets.

FBS at social media

iconhover iconiconhover iconiconhover iconiconhover icon

Contact us

iconhover iconiconhover iconiconhover iconiconhover icon
store iconstore icon
Get on the
Google Play
store iconstore icon
Get MT4 on the
App Store
store iconstore icon
Get MT5 on the
App Store

Trading

Company

About FBS

Our social impact

Legal documents

Company news

FC Leicester City

Help Center

Partnership programs

The website is operated by FBS Markets Inc.; Registration No. 000001317; FBS Markets Inc. is registered by the Financial Services Commission under the Securities Industry Act 2021, license number 000102/31. Office Address: The Bentley, #16 Cor A Street & Princess Margaret Drive, Belize City, Belize.

FBS Markets Inc. does not offer financial services to residents of certain jurisdictions, including, but not limited to: the USA, the EU, the UK, Israel, the Islamic Republic of Iran, Myanmar.

Payment transactions are managed by HDC Technologies Ltd.; Registration No. HE 370778; Legal address: Arch. Makariou III & Vyronos, P. Lordos Center, Block B, Office 203, Limassol, Cyprus. Additional address: Office 267, Irene Court, Corner Rigenas and 28th October street, Agia Triada, 3035, Limassol, Cyprus.

Contact number: +357 22 010970; additional number: +501 611 0594.

For cooperation, please contact us via [email protected].

Risk Warning: Before you start trading, you should completely understand the risks involved with the currency market and trading on margin, and you should be aware of your level of experience.

Any copying, reproduction, republication, as well as on the Internet resources of any materials from this website is possible only upon written permission.

The information on this website does not constitute investment advice, a recommendation, or a solicitation to engage in any investment activity.