A Pennant pattern is a subtle but powerful signal that a trend isn’t done yet. In this article, we’ll break down the bullish and bearish Pennant patterns, how to spot them on a chart, and how to trade them with confidence.
July 30, 2025
Strategy
A Pennant pattern is a subtle but powerful signal that a trend isn’t done yet. In this article, we’ll break down the bullish and bearish Pennant patterns, how to spot them on a chart, and how to trade them with confidence.
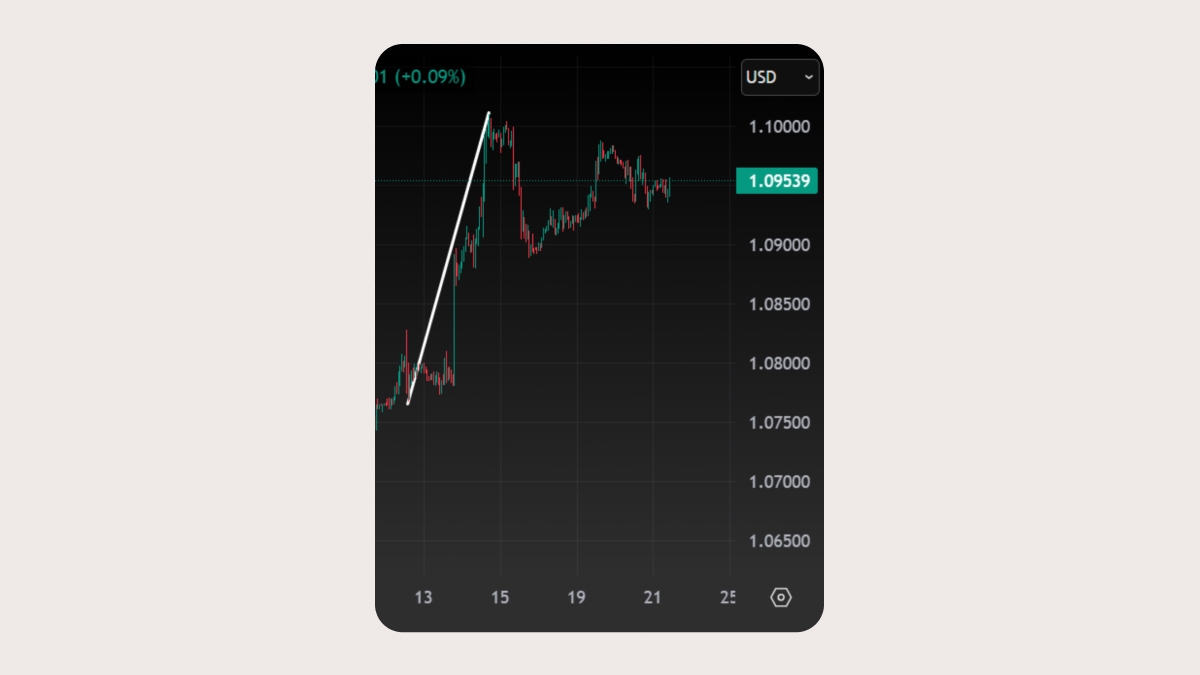
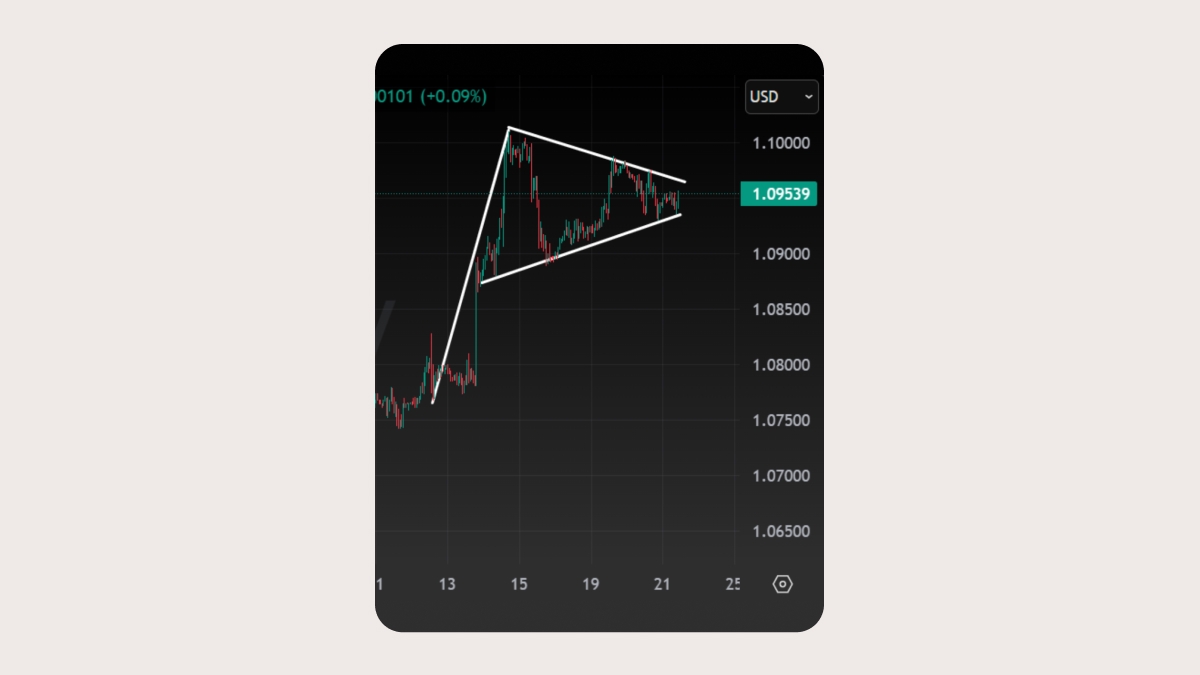
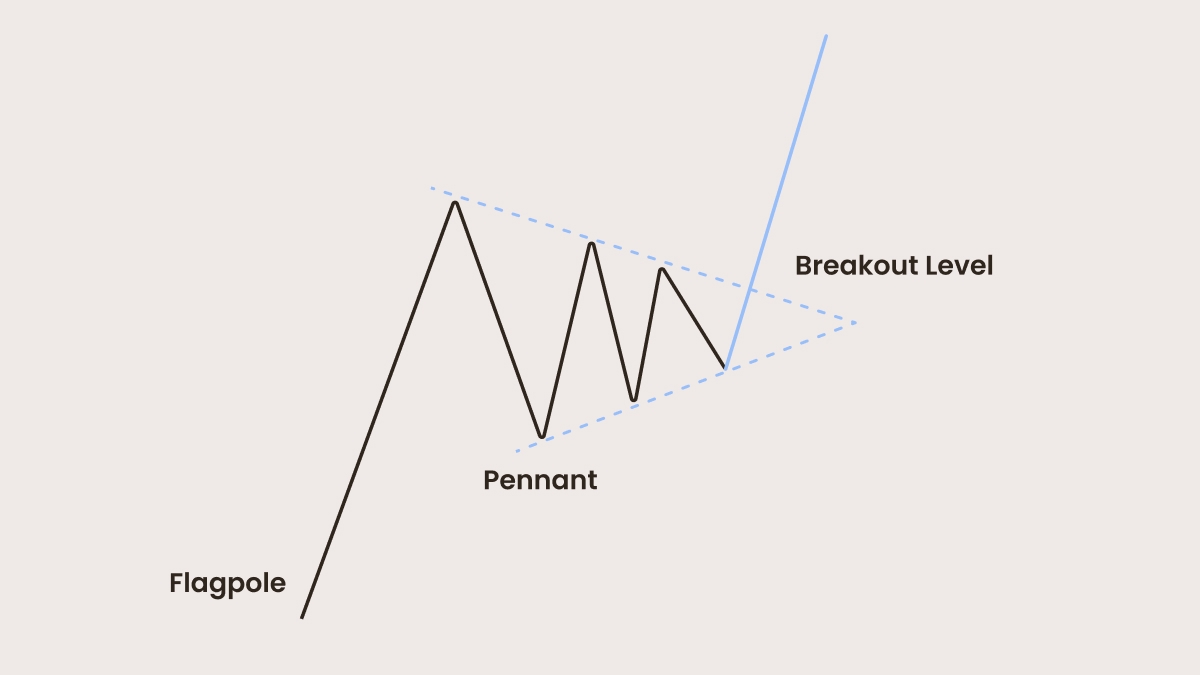
The Pennant pattern is a trend continuation pattern on the chart. It occurs after a strong price movement (known as a flagpole), followed by a small consolidation where the price moves within converging trend lines. After that, a breakout happens, usually in the same direction as the initial move. It’s often mistaken for a Flag or Triangle pattern, but the Pennant is unique because of its symmetrical, tapering structure formed by converging trend lines.
Look out for these three main elements on the chart:
The flagpole
The Pennant: a small consolidation area shaped like a tiny triangle. It’s formed by converging trend lines.
The Pennant
Breakout: a continuation of the original trend, breaking through the Pennant’s structure.
Volume behavior can be a good clue when trading with this pattern:
during the flagpole the volume surges,
then drops as the market consolidates inside the Pennant,
and, finally, rises sharply again when breaking through the pattern.
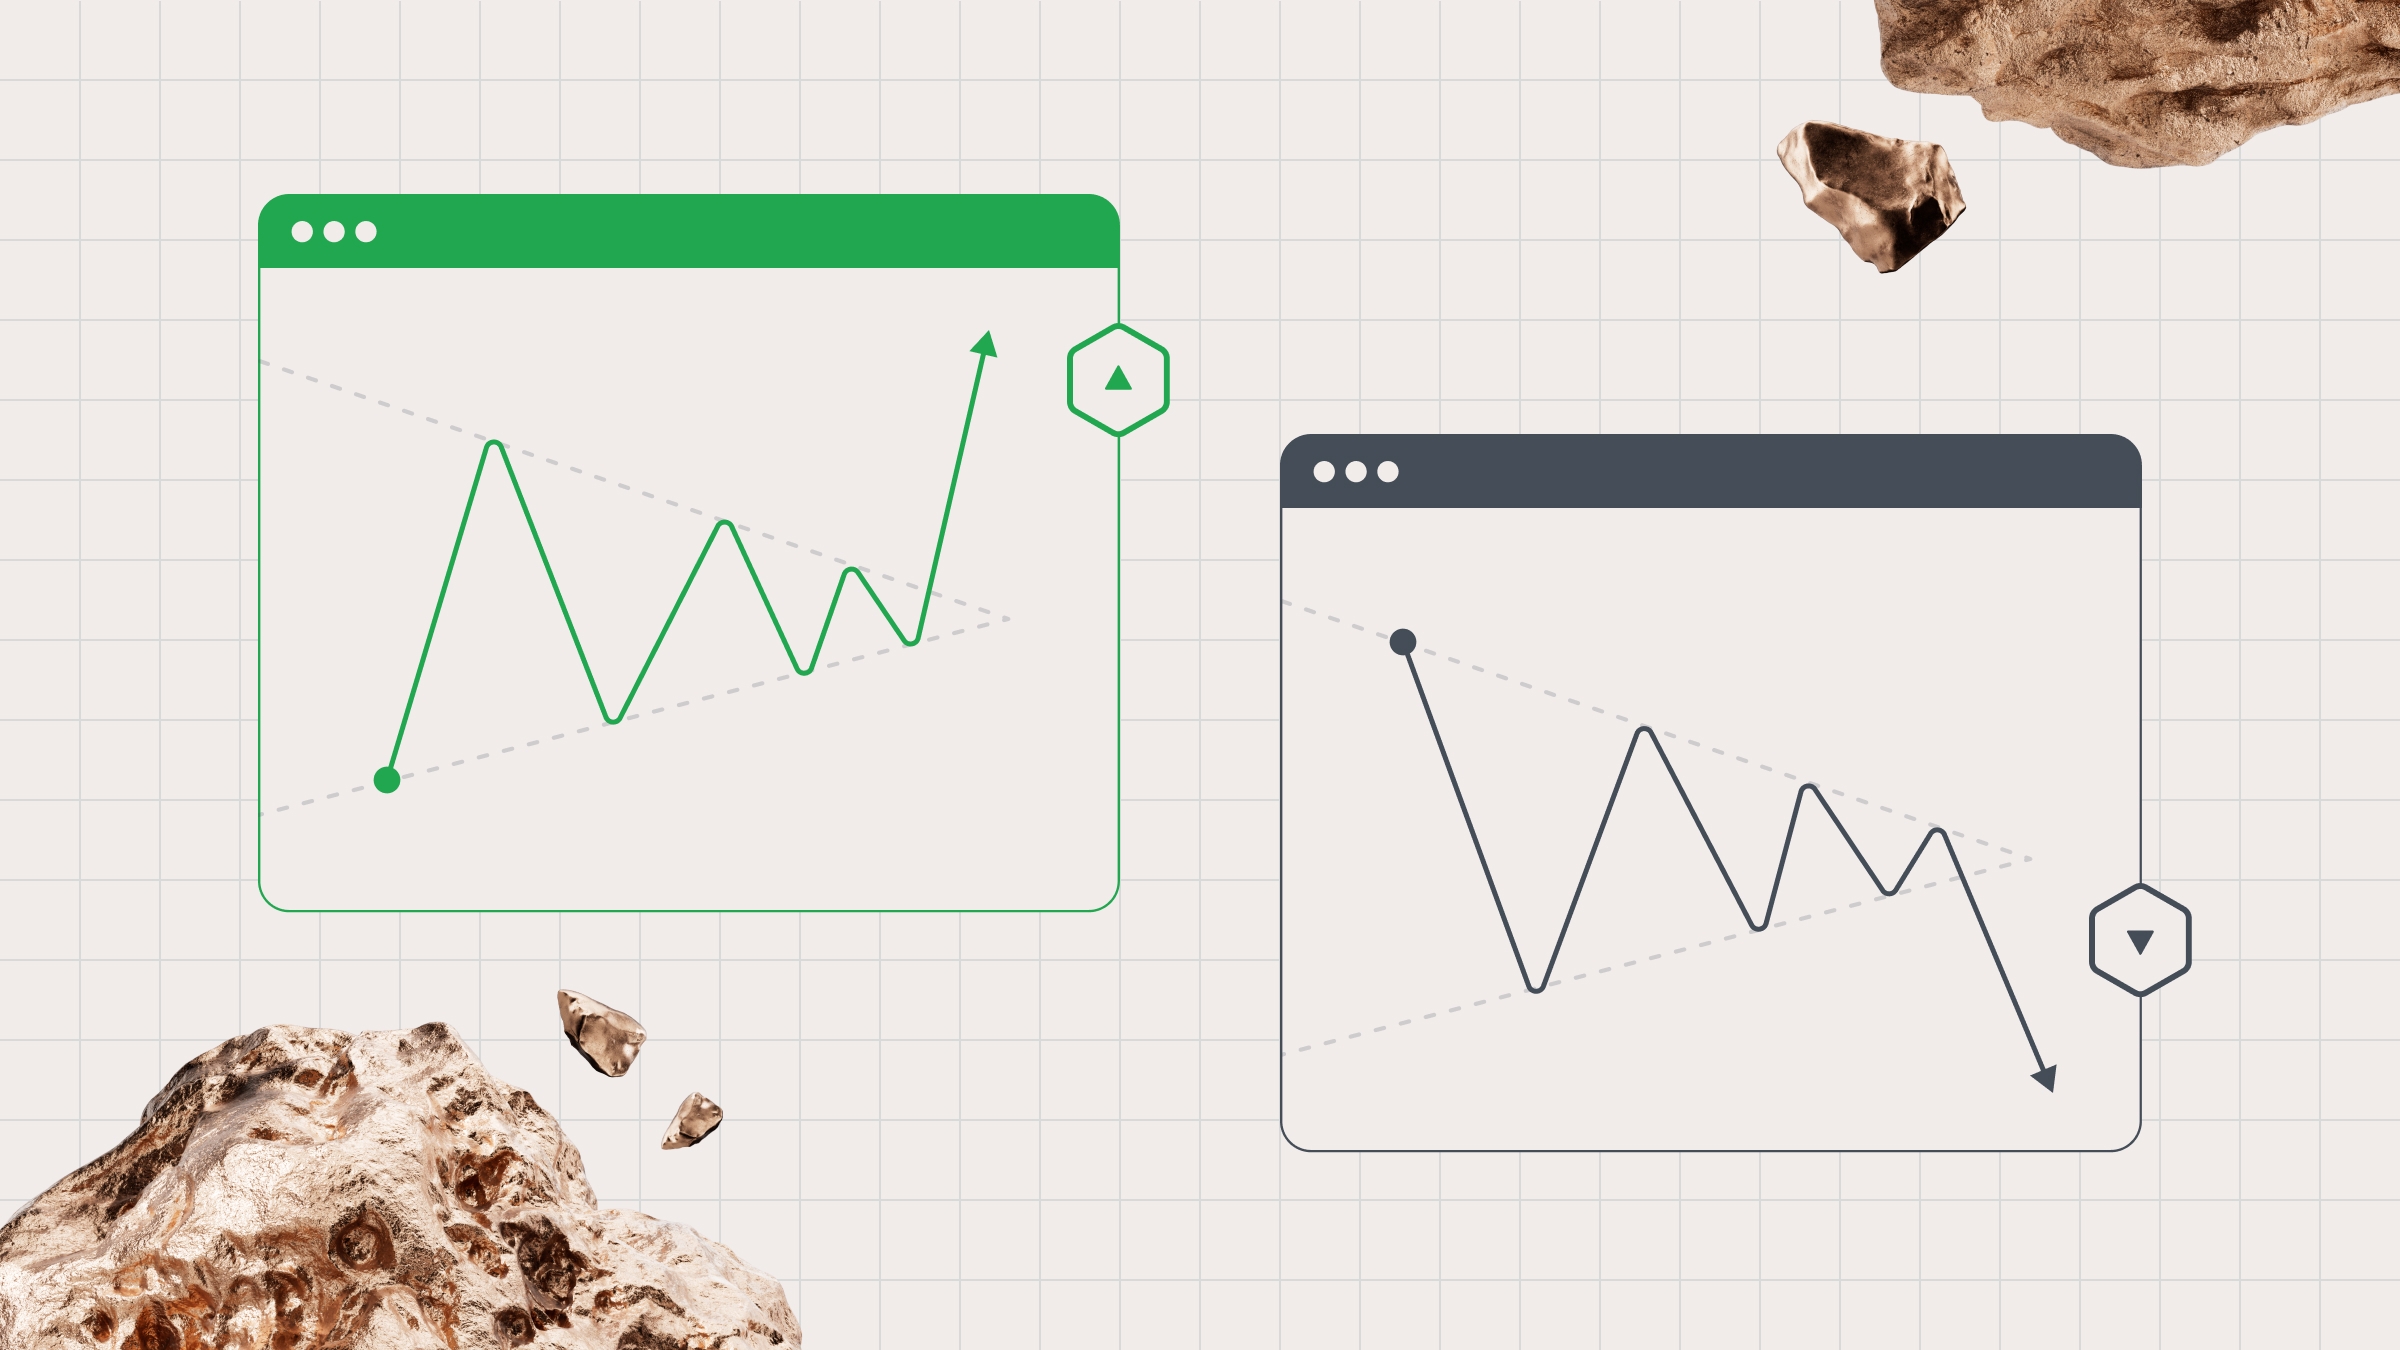
A bullish Pennant pattern
The bullish Pennant pattern appears during a strong uptrend. After a sharp price increase (the flagpole), the market pauses briefly (consolidation), creating a narrowing formation known as a pennant. Then, the price breaks out upward: that’s the signal that the bullish trend is continuing.
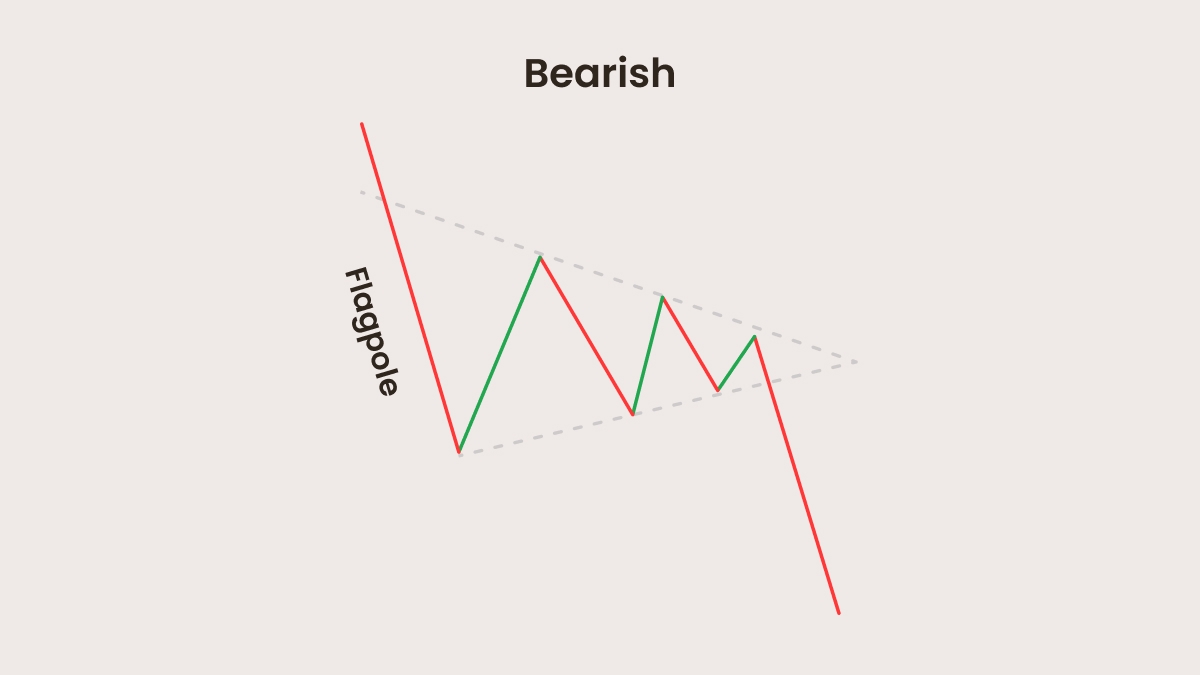
The bearish Pennant pattern
A bearish Pennant pattern is a little different: it forms after a strong downward move. The market consolidates slightly in a narrowing range before continuing downward. A breakdown below the lower border of the pattern will trigger a further decline, giving traders opportunity to open a short trade. Stop-losses are typically placed above the upper border and the previous lower high.
Practice trading Pennants risk-free and build your skills with FBS — just open a demo account.
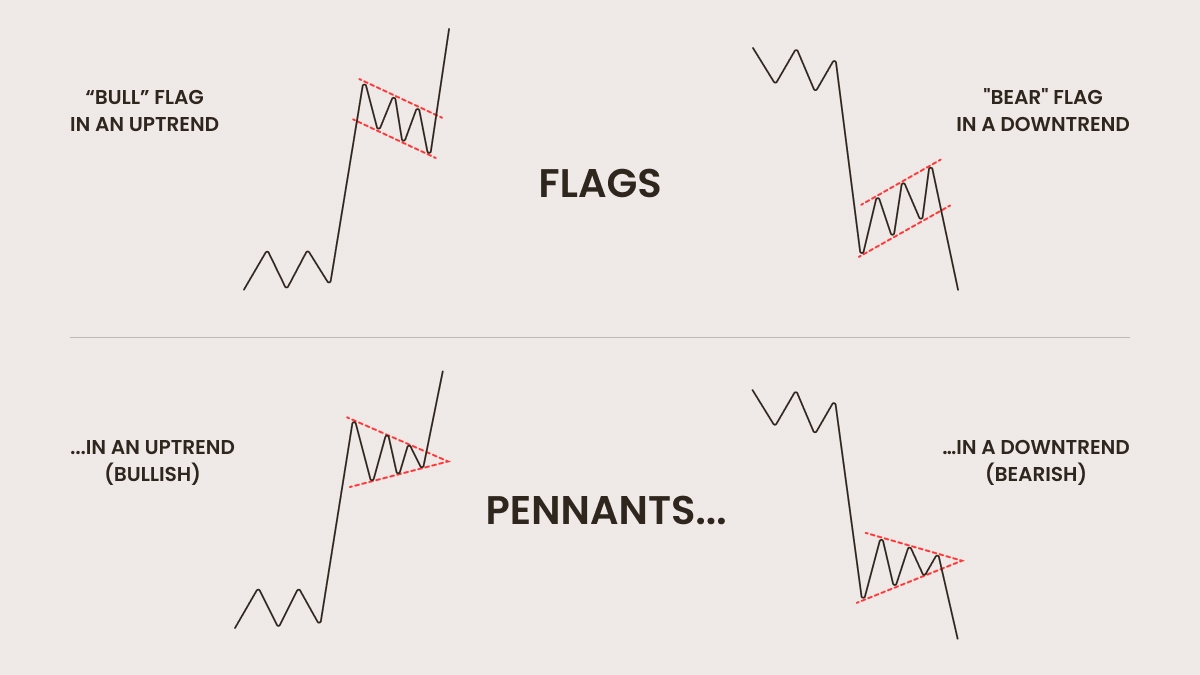
Flag patterns vs Pennant patterns
It’s easy to confuse Flag and Pennant price patterns because they look almost identical and both are trend continuation patterns. Here’s a table that will help you to tell them apart.
| Feature | Pennant pattern | Flag pattern |
| Shape | Small symmetrical triangle | Small parallelogram or rectangle |
| Trendlines | Converging (like a triangle) | Parallel (sloping or flat) |
| Volume behavior | The pattern begins with high trading volume, which lowers during consolidation and then surges again at the breakout. | Similar low volume in consolidation |
| Psychology | A tighter consolidation reflects greater market uncertainty — a clear battle between bulls and bears. | Clear direction in short-term correction |
Both patterns represent continuation, but Pennants usually have slightly stronger potential breakouts due to the tighter consolidation range.
To learn about other powerful patterns, read the FBS article Common Trading Chart Patterns You Should Know.
How to trade the Pennant Flag pattern
Identify the uptrend: look for a strong price movement.
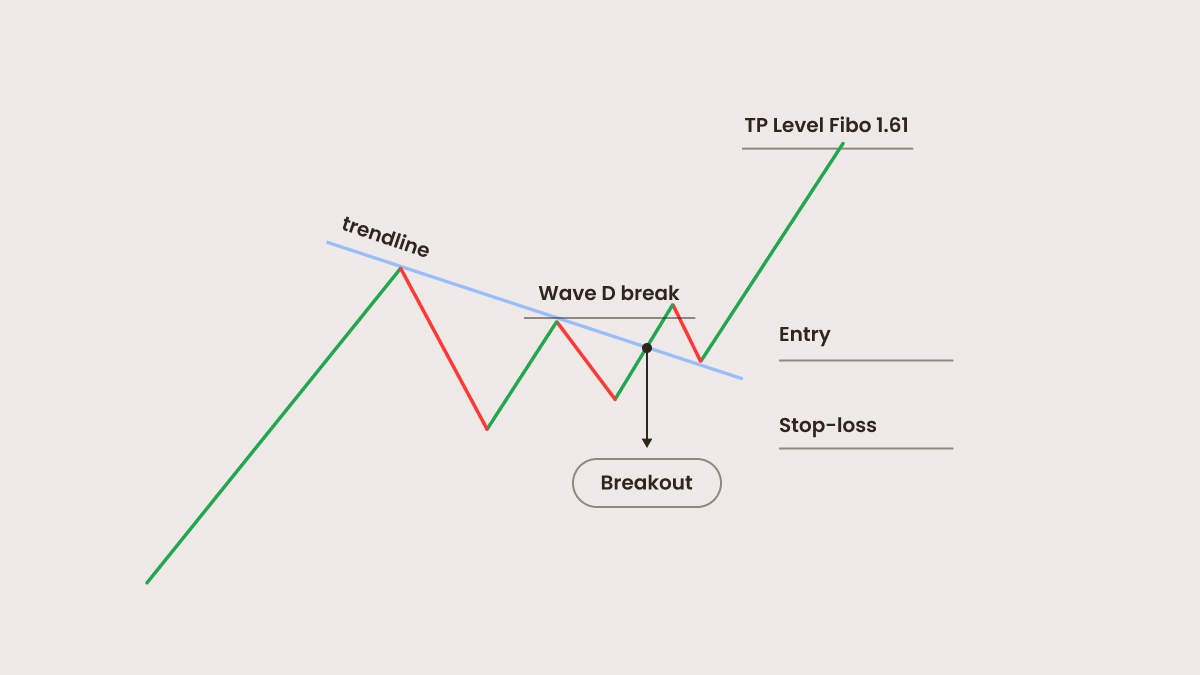
Draw the flagpole, then connect the lower highs and higher lows to form a symmetrical triangle.
Confirm the pattern. Confirmation is key: make sure the pattern is symmetrical with converging trendlines, validate the trend (bullish or bearish), and check the volume.
Wait for a breakout: when the price breaks above the upper boundary of the Pennant, it gives an exact signal of the continuation of the bullish rally.
Enter the trade. For a bullish Pennant, enter a long position above the breakout; for a bearish, enter a short position below the breakdown.
Apply risk management techniques. Use a stop-loss: for the bullish Pennant, set it below the previous higher low; for the bearish, above the last lower high. Also set a take-profit order with at least a 1:2 risk-to-reward ratio, or use 161.8 Fibonacci retracement.
Make a retest entry (optional). Sometimes price retests the broken trendline before continuing the move. It provides another chance to enter with lower risk and a tighter stop-loss.
A quick tip: when trading a bullish Pennant, wait for a breakout candle to close above the pennant with increased volume for higher confidence. Don't jump into the trade too early, it’s better to wait for additional confirmation with a solid breakout candle and volume spike.
Jumping in too early before confirmation. It is dangerous. Always wait for a breakout just to be sure.
Ignoring volume: it is a key part of pattern validation.
Confusing Pennants with Triangles or Flags: the shape and context matter.
Poor risk management: never trade without setting solid stop-loss and realistic take-profit orders.
Not checking the trend: remember that Pennants are continuation patterns, not reversals (though they may act as those in rare cases).
Put your knowledge to action with FBS: trade confidently!
By registering, you accept FBS Customer Agreement conditions and FBS Privacy Policy and assume all risks inherent with trading operations on the world financial markets.