Real Examples of Bullish Harami in Action
Take a look at a textbook example of a Bullish Harami Pattern.
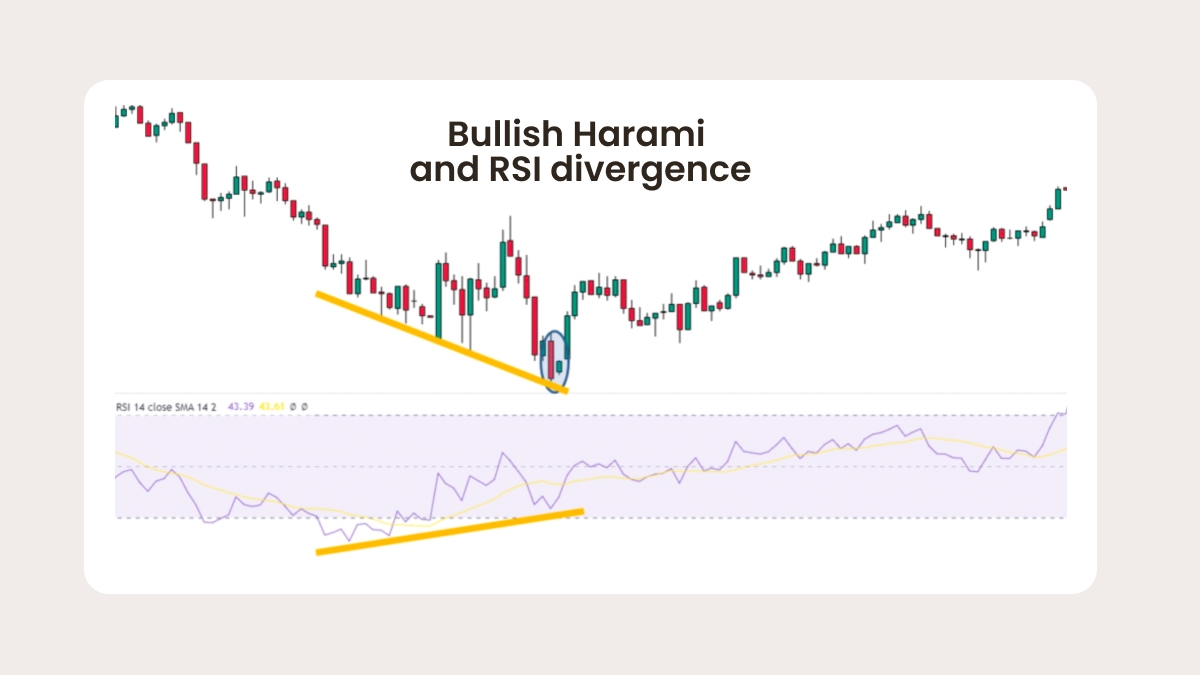
Here we see a long bearish candle hugging a small bullish one. But is that enough to say that it’s a Bullish Harami? No. The RSI bullish divergence confirms weakening momentum, volume spikes slightly on the green candle and a strong downtrend is obvious. Now we can be sure this is the Bullish Harami. This setup shows how the pattern can serve as an early signal of reversal when supported by broader market context — only a signal, not a guarantee. Here, both price action and indicator confirmation align, leading to a sustained move higher.
Pros and cons of the Bullish Harami
No pattern is perfect, so be aware of these pros and cons of the Bullish Harami and use them to your advantage.
Pros:
It’s an early signal of potential reversal, often even before indicators react.
It’s easy to spot on the chart, no complex tools required.
It works well with confluence setups (support zones, RSI divergence).
Cons:
Alone it can fail. There’s a high rate of false signals without confirmation.
It has weak momentum, because it usually signals a pause rather than a reversal.
It needs volume, trend context, or secondary signal for actionability. Don’t hesitate to use additional evidence for confirmation.
The Bullish Harami is a useful tool, but only with the right filters.
FAQ
Is the Bullish Harami reliable?
Don’t rely on it alone. It needs context – ideally, a clear downtrend, volume shift, or indicator divergence. Without that, it can easily fail. Always combine it with confirmation.
Can it be used on intraday charts?
Yes, but be cautious. Lower timeframes like 5M or 15M typically produce more noise and false signals. Use smaller positions or wait for confirmation from higher timeframes.
What timeframe is best?
For crypto, H1 and higher offer better structure and fewer fakeouts, while for stocks and Forex, 4H to daily charts work well for swing trading.
Bullish harami vs engulfing: which is stronger?
Engulfing patterns often trigger sharp reversals because they show full rejection of prior momentum. Harami is a softer and more cautious signal. It typically requires additional confirmation such as RSI divergence, volume support, or a key level bounce.
Summary
The Bullish Harami isn’t a holy grail, it’s an early warning signal best viewed as an alert. Go beyond patterns and build a story around them: consider the broader trend, the momentum and other filters to make a low-risk entry.
Trade on the Bullish Harami with FBS and grow your wealth. Join the community now.